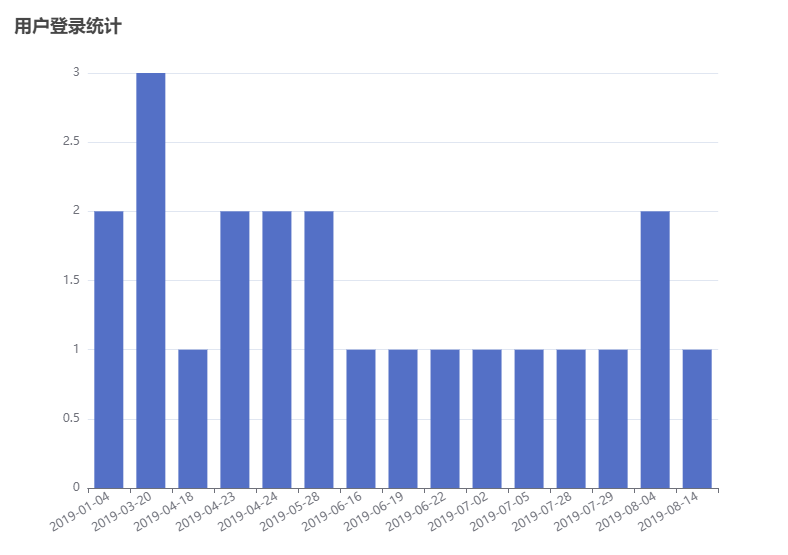
vue中用了echarts数据统计图,发现动态赋值不显示,对于不渲染问题,我们只需在methods方法下重新渲染即可解决该问题
前端代码:
<template>
    <div>
		<div id="main" style="width: 100%;height:545px;"></div>
	<div>
<template>
js代码:
<script>
import * as echarts from 'echarts';

  methods: {
    async getSys () {
      const { data: res } = await this.$http.get('system')
      if (res.code != 200) {
           this.$message.error(res.msg)
        }
      this.countVip = res.data.countVip
      console.log( this.countVip.num)
      // 绘制图表
      var myChart = echarts.init(document.getElementById('main'));
        myChart.setOption({
            title: {
                text: '日期'
            },
            tooltip: {},
            xAxis: {
                data: this.countVip.date,
                axisLabel: {
                  interval:0,
                  rotate:30
                },
            },
            yAxis: {},
            series: [{
                name: '人数',
                type: 'bar',
                data: this.countVip.num
            }]
        },true);
    }
  }

</script>


 关于简忆
关于简忆 简忆诞生的故事


 粤ICP备16092285号
文章评论(0)