后台管理系统离不开数据统计,数据统计离不开统计图,本文介绍如何在vue中使用echarts
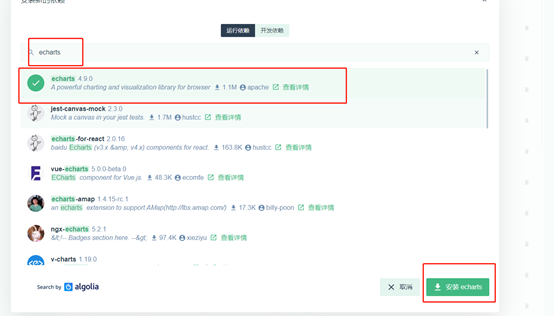
1、安装echarts

或通过 npm 获取 echarts,
npm install echarts –save
附echarts文档:https://echarts.apache.org/zh/tutorial.html#5%20%E5%88%86%E9%92%9F%E4%B8%8A%E6%89%8B%20ECharts
Demo实例
<template>
    <div>
        <!-- 面包屑导航区 -->
        <el-breadcrumb separator-class="el-icon-arrow-right">
        <el-breadcrumb-item :to="{ path: '/home' }">首页</el-breadcrumb-item>
        <el-breadcrumb-item>数据统计</el-breadcrumb-item>
        <el-breadcrumb-item>数据报表</el-breadcrumb-item>
        </el-breadcrumb>
        <!-- 卡片视图 -->
        <el-card>
            <div id="main" style="width: 100%;height:400px;"></div>
        </el-card>
    </div>
</template>
<script>
// 导入echarts
import echarts from 'echarts'
export default {
data(){
return {}
},
created(){
},
// 此时页面上的元素已被渲染完毕
mounted(){
// 基于准备好的dom,初始化echarts实例
var myChart = echarts.init(document.getElementById('main'));
// 指定图表的配置项和数据
var option = {
title: {
text: '数据报表'
},
tooltip: {
trigger: 'axis',
axisPointer: {
type: 'cross',
label: {
backgroundColor: '#6a7985'
}
}
},
legend: {
data: ['前端', '后端', '其他']
},
color: ['#fb5e8e','#a7e174', '#69b5fa'],
toolbox: {
feature: {
saveAsImage: {}
}
},
grid: {
left: '3%',
right: '4%',
bottom: '3%',
containLabel: true
},
xAxis: [
{
type: 'category',
boundaryGap: false,
data: ['周一', '周二', '周三', '周四', '周五', '周六', '周日']
}
],
yAxis: [
{
type: 'value'
}
],
series: [
{
name: '前端',
type: 'line',
stack: '总量',
areaStyle: {},
data: [120, 132, 101, 134, 90, 230, 210]
},
{
name: '后端',
type: 'line',
stack: '总量',
areaStyle: {},
data: [220, 182, 191, 234, 290, 330, 310]
},
{
name: '其他',
type: 'line',
stack: '总量',
areaStyle: {},
data: [150, 232, 201, 154, 190, 330, 410]
}
]
};
// 使用刚指定的配置项和数据显示图表。
myChart.setOption(option);
},
methods: {
}
}
</script>


 关于简忆
关于简忆 简忆诞生的故事


 粤ICP备16092285号
文章评论(0)